Tips on proxying with the Squid caching software. See also Squid: The Definitive Guide.
Tips & Tricks
- Log files
- squidclient
- Custom Refresh Patterns
- Remote Refreshing
Consult the cache_access_log, cache_log, and cache_store_log for logs from squid. Various log file analysis scripts can make use of this data.
Use the squidclient command to check on squid. For a list of available options, specify no path after the server in the URL, or for an overview, use the info URL:
$ squidclient cache_object://localhost/
…
$ squidclient cache_object://localhost/info
…
By default, cache_object requests should be allowed from localhost:
$ grep manager /etc/squid/squid.conf
acl manager proto cache_object
http_access allow manager localhost
http_access deny manager
Where appropriate, set custom refresh_pattern for different areas of a website. This allows static content to remain cached for long periods of time, while allowing dynamic content to update frequently.
refresh_pattern . 15 75% 4320
refresh_pattern /blog/ 0 15% 360
refresh_pattern /blog/images/ 15 75% 4320
Planning where content resides will allow for cleaner refresh_pattern statements, for example by locating all images on a different server, or under a top level /images path.
While squidclient can invalidate cache content, it may not be practical over the Internet. If the refresh_pattern settings allow, a remote web client can force web content to refresh by employing the Cache-Control header of the Hyper Text Transfer Protocol (HTTP).
$ lwp-request -H 'Cache-Control: no-cache' http://example.org/
Older web servers may also need the Pragma: no-cache header specified. These headers can be encoded into a LWP::UserAgent based script as follows.
#!/usr/bin/perl
#
# Accept URL to refresh on website. Qualify relative URL with base
# specified below.
die "Usage: $0 uri [... uri]\n" unless @ARGV;
use LWP::UserAgent ();
use URI ();
my $BASE_URI = 'http://example.org';
my $ua = LWP::UserAgent->new;
$ua->env_proxy;
$ua->default_header(qw{Cache-Control no-cache});
$ua->default_header(qw{Pragma no-cache});
for my $input (@ARGV) {
my $uri = URI->new_abs( $input, $BASE_URI )->canonical;
$ua->get($uri);
}
Forward Proxy
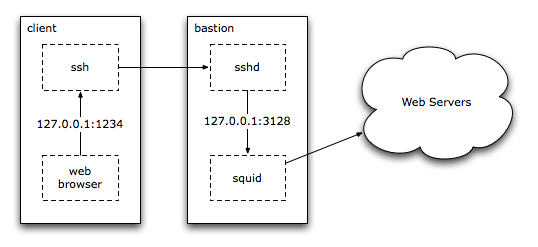
I use something like squid-forward.conf to provide caching and to grant website access inside a firewalled network via a SSH tunnel.

Reverse Proxy

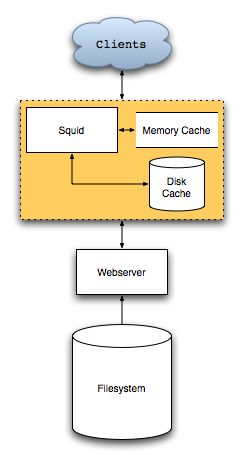
As a reverse proxy (or “accelerator”), squid stands between clients and one or more web servers, and is run by the administrators of the web servers, not the client or ISP for the client. Advantages include:
- Caching
- Flexibility
Frequently requested files will be cached on disk or in memory. squid should be more efficient, especially if the web server uses a heavyweight process to generate the data, or if the files reside on a slow filesystem. This way, an inexpensive large filesystem can hold the raw data, and a smaller, faster disk array hold commonly request files for quicker access.
Caching fails if the web server does not generate various headers required for squid to cache content. Many CGI scripts and other applications do not generate these headers, or may use poor URL design that thwarts caching: each URL must generate the same content. If different content for the same URL is returned based on the client’s request, a reverse proxy should not be used.
The web server behind the cache can be moved to different systems, or a new web server upgraded to by changing squid.conf. If the new web server has problems, the old one can be brought back online quickly by reversing the configuration change.

Disadvantages include the additional complexity, problems with URLs if the back end web servers run under a different name or port, and harder to parse log files. Back end web servers may also have trouble obtaining the client’s address, available in the X-Forwarded-For HTTP header.
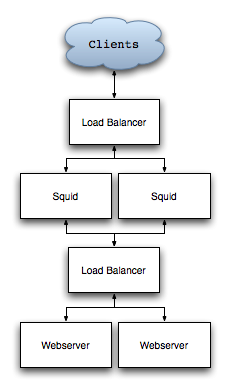
Larger sites may require load balancers, such as Linux Virtual Server or commercial products. In this case, clients will send requests to the load balancer, which in turn connect to two or more squid proxies. The squid proxies access another load balancer (usually the same hardware, but to a different virtual address), which handles connections to the web servers.
When to Cache
Caching will not be efficient if clients request more active data than squid can hold in memory or on disk. In such cases, squid will swap data in and out of the cache far too often (check the store_log log file). If possible, mine existing logs to determine how suitable squid would be for a site:
- Request Duplication Percentage
- Cache Storage Needs
- Mean Object Size

This percentage shows how often URLs are requested inside a particular timeframe. 100% indicates only one item has been requested, while 0% shows no duplicate requests were made. Calculation: sum both the total amount of data moved, and that moved for each unique URL. Divide the unique total by the overall total, subtract that value from one, and multiply by 100. Low percentages may not benefit as much from a squid cache.
For example, as the sial.org website has run behind squid for years, the following calculation is performed against the squid log, rather than the Apache log. The $F[4] refers to the request size in bytes, and $F[6] the URL of the request. Only 200 and 206 HTTP status requests are considered. This calculation assumes each unique URL always returns the same content over the given timeframe.
$ perl -lane '$t += $F[4]; $u += $F[4] unless $seen{$F[6]}++;' \
-e 'END { print "unique=$u total=$t" }' /var/log/squid/access_log
unique=9145670 total=75352325
$ perl -e 'printf "%.1f%%\n", (1 - (shift)/(shift))*100' 9145670 75352325
87.9%
The high percentage shows most requests on sial.org site are to previously seen URLs, over the 24 hour log file duration. For ongoing reference, squid will show request hit ratios under the info URL:
$ squidclient -p 80 cache_object://localhost/info | grep Ratio
Request Hit Ratios: 5min: 91.3%, 60min: 83.4%
Byte Hit Ratios: 5min: 92.8%, 60min: 88.3%
Request Memory Hit Ratios: 5min: 85.7%, 60min: 85.5%
Request Disk Hit Ratios: 5min: 0.0%, 60min: 3.0%
The following should work for the Apache access log format. Be sure to check the columns, some Apache logs may use a different fromat, or include a HTTP/1.1 column in the output that throws off the numbers below.
$ perl -lane 'next unless $F[8] eq "200" or $F[8] eq "206";' \
-e '$t += $F[9]; $u += $F[9] if !$seen{$F[6]}++;' \
-e 'END { print "unique=$u total=$t" }' \
/var/www/logs/access_log
The squid cache must be able to hold more than the amount of active content during a given timeframe: assuming a website has 100G total content, if only a 10G disk cache is available for squid, but clients request 20G of unique content in an day, squid will waste time and consume I/O swapping data through the undersized disk cache. Use the unique request size (calculated above) to determine how large the squid disk cache should be, then calculate how much a suitable disk array will cost. The cache size should be padded to account for growth and overhead, though new cache_dir directories can be added to squid over time.
squid will benefit from fast disks, for example SCSI RAID 1+0. A dedicated cache system should not share this space with the operating system or other applications.
squid assumes a certain mean object size. Larger (or smaller) content may require different configuration of squid. Extremely large content may not cache in squid at all.
Sample Accelerator Configuration
See the example squid.conf configuration file. This configuration assumes the single web server being accelerated runs at port 7654 on 172.0.0.1. Caching is performed even when the URL contains cgi-bin or the ? character (opposite the squid default).
Apache has various problems when being run at a high loopback port, such as generating URLs that include 127.0.0.1:7654 instead of the public address and port squid listens on. One solution to the high-port problem: run squid bound to port 80 of the server’s public address, such as 192.0.2.10:80, and the web server bound to port 80 of the loopback address (127.0.0.1:80).
Non-cached resources such as dynamic Common Gateway Interface (CGI) pages can either be located on a separate server, or excluded from caching in the proxy configuration.
hierarchy_stoplist somedir someotherdir
acl THEUNCACHEABLES urlpath_regex somedir someotherdir
no_cache deny THEUNCACHEABLES
Performance Review
squid may exhibit poor performance should the disk array be slow. First, review the median request times from the info cache_object URL:
$ squidclient -p 80 cache_object://localhost/info | \
perl -nle 'print if /^Median/../ICP/'
Median Service Times (seconds) 5 min 60 min:
HTTP Requests (All): 0.01387 0.02317
Cache Misses: 0.00194 0.02069
Cache Hits: 0.01556 0.02592
Near Hits: 0.04047 0.03427
Not-Modified Replies: 0.00000 0.00494
DNS Lookups: 0.00000 0.00000
ICP Queries: 0.00000 0.00000
However, even with low median values, certain requests could take too long. Also consider the maximum request time and standard deviation, as despite a low median, a system may have various requests that take far too long to complete. squid stores the request time in the second column of the access_log log file, which allows various mathematical tests with the mathu utility:
$ awk '{print $2}' access_log | mathu basic
count 8666
max 124846
mean 257.48
min 0
sdev 2535.34
sum 2231304
Investigate slow requests by searching for the mean plus one standard deviation, or 2792 from the above log file:
$ perl -lane 'print if $F[1] > 2792' access_log
…
Categorize the slow requests by how squid handled the request for more information, then look at the request types: slow TCP_MISS indicate the web server behind squid is slow (check the URL and determine why, if possible). Slow TCP_HIT may indicate disk performance problems on the cache system.
$ perl -lane '$type{$F[3]}++ if $F[1] > 2792;' \
-e 'END { print "$type{$_} $_" for keys %type }' access_log | sort -n
1 TCP_MISS/200
2 TCP_MISS/206
4 TCP_REFRESH_HIT/200
5 TCP_HIT/200
25 TCP_MEM_HIT/200
134 TCP_MISS/302
The majority of slow requests shown above are TCP_MISS/302, or missed redirects. A check on the log file for these requests indicates each is a directory hit without the trailing slash (e.g. /howto/squid instead of /howto/squid/). This is expected for the custom code sial.org runs.
$ perl -lane 'print if $F[1] > 2792 and $F[3] =~ m/^TCP_MISS/' access_log \
| less -S
…
The 25 slow TCP_MEM_HIT from the above output require investigation. Most (72%) are requests for (large) images or PDF documents:
$ perl -lane 'print if $F[1] > 2792 and $F[3] =~ m/^TCP_MEM_HIT/' access_log \
| egrep -c '(image/|application/pdf)'
18
The remaining seven slow requests include one misidentified image, and four requests for a large document made over the course of the day. The slow requests comprise only 0.43% of the total requests for the time period (171 minus the 134 TCP_MISS/302), so therefore are not worth worrying about.
Also check the time when slow requests are made; if squid must contend with other applications (such as daily cron(8) jobs), requests may be delayed during certain time periods. Check the crontab(5) file for root, or the global /etc/crontab file to determine when the standard automated runs take place on the host operating system. Automated jobs may run from different locations on various operating systems. The epoch2date utility can convert from the epoch value in the squid logs to a human readable format, for example to show the times of the slow requests (minus the large image files):
$ perl -lane 'print if $F[1] > 2792 and $F[3] =~ m/^TCP_MEM_HIT/' access_log \
| egrep -v '(image/|application/pdf)' | awk '{print $1}' | epoch2date -
2005-11-01 00:46:20.560
2005-11-01 04:29:58.891
2005-11-01 06:10:36.573
2005-11-01 08:13:11.678
2005-11-01 09:43:34.743
2005-11-01 12:26:58.123
2005-11-01 13:40:21.210
These results show no particular grouping of slow requests by time.
