The many flavors of Unix operating systems complicate system diagnosis and debugging. Resources like the Rosetta Stone for Unix help catalog the differences. If new to Unix administration, supplement the vendor supplied documentation with a general handbook such as the Unix System Administration Handbook or Linux Administration Handbook.
Establish baselines: debug existing systems to learn how they work under normal operation. New systems and products should likewise be investigated. Write scripts to check for common problems, and run them automatically from monitoring services such as Nagios. Setup profiling to trend usage over time and spot slow performance. Many Round Robin Database (RRD) based tools collect and display trending information.
Problems must be debugged in depth (in particular components) and breadth (across the various interacting components of the system). Check that the data input—at the file or network level—is correct. If so, then check inside the program. Reduce the problem at each separate level (network, filesystem, programming language, different scripts or modules) and then combine that information to discover how the system works, and where any faults are:
“There are two ways to understand complicated things as a complicated
machine. Either can the master, who has built the machine, show you
what he has done and how the machine works. Or you can investigate
every single part and—to begin with—understand them individually.
Thereafter, you must also put all the individual parts together in
order to understand how they work in coherence.”
— Steno, 1665, translated by Jens Morten Hansen, 2009.
Another best practice: that something “doesn’t work” is practically useless information. Instead, observe the inputs, outputs, any error messages. Can the inputs be altered? Does that change the output or the error? Is there a pattern to how the output is wrong? Does working back from the incorrect output help pinpoint what is wrong? Ask questions!
Dæmons
Find where they launch from, and how to toggle their startup status, and check whether they are actually running properly. This varies by system, system release, and the site in question. Places to look under or in include the init.d or rc.d directories under /etc or perhaps /sbin. Tools like lsof can determine what files and ports a process has open.
Older BSD systems use /etc/rc and /etc/rc.conf, along with *.local files for local configuration, and maybe also under /usr/local/etc. Newer BSD might use RC "next generation".
Mac OS X systems have changed over the various releases, moving from /etc/rc scripts to SystemStarter that reads startup scripts from /System/Library/StartupItems or /Library/StartupItems directories or now launchd(8). Check /etc/hostconfig for startup toggles, or consult the documentation for the release in question to see if Apple changed the launch system again.
Dæmons might also be running out of /etc/inittab or crond, or any number of other custom things, such as daemontools.
On systems that do not randomize the process numbers, sorting running services by the PID may indicate when or where an early process was started. On Mac OS X, for instance, /sbin/init is launched as process one, followed by OS X specific processes such as /sbin/mach_init and netinfod.
$ ps awxo pid,command | sort -n | head -10
PID COMMAND
1 /sbin/init
2 /sbin/mach_init
84 kextd
86 /usr/sbin/configd
87 /usr/sbin/diskarbitrationd
92 /usr/sbin/notifyd
117 netinfod -s local
119 update
121 /System/Library/CoreServices/coreservicesd
Files
Contents of files on Unix may cause problems, such as a login failing due a shell of /bin/sh instead of /bin/sh, only the second of which being permitted under /etc/shells. Check file contents carefully to determine whether any significant yet invisible whitespace exists, should logins fail and no other cause of failure be found, for example with od(1) or hexdump(1):
$ </etc/passwd awk -F: '/^root:/{print $NF}' | od -bc
0000000 057 142 151 156 057 163 150 040 012
/ b i n / s h \n
0000011
This sort of issue is common where important configuration files are edited by hand. If possible, tools should be used to create the passwd data, to ensure troublesome characters are not accidentally entered. For example, use instead the various useradd scripts, or write a custom tool that audits the passwd data for shells not in /etc/shells, among other syntax errors. Become familiar with the ascii(7) encodings, so that strange characters can be quickly recognized.
Useful tools for debugging file contents include file(1), od(1) (or the newer hexdump(1) I have yet to figure out), and strings(1).
$ file index.xml
index.xml: UTF-8 Unicode English text, with very long lines
$ head -1 index.xml | od -bc
0000000 357 273 277 074 077 170 155 154 040 166 145 162 163 151 157 156
357 273 277 < ? x m l v e r s i o n
0000020 075 042 061 056 060 042 040 145 156 143 157 144 151 156 147 075
= " 1 . 0 " e n c o d i n g =
0000040 042 165 164 146 055 070 042 077 076 012
" u t f - 8 " ? > \n
0000052
$ sudo strings /var/log/wtmp | grep -v tty | sort | uniq
…
Some systems have a /proc filesystem that contains interesting data. For example, under Linux one may want to know what the environment settings are for a particular proccess, in this case that of the running shell itself. This could be used (or abused) by the superuser to check whether a user process has a particular environment variable set.
$ tr \\000 \\n < /proc/$$/environ
…
Logging
Logging may help debug problems, assuming logs are being generated and properly stored and analysed. Applications may use their own custom logfiles— check the configuration files, or use lsof to look for open log files— or send logs via syslog(3). For the stock syslogd on Unix, check /etc/syslog.conf for logging rules, and ensure syslogd is running.
Consolidating logs into a single file or database with syslog(3) or better protocols can ease debugging by avoiding the need to consult many different logfiles and log formats. More information on setting up logging and analyzing logfiles is available.
Network
To debug network protocols, tools such as tcpdump, tcpflow, or wireshark may be required. First determine whether the required traffic is even being seen by the systems in question (via tcpdump on the systems), then move on to the contents of the traffic (tcpflow or ethereal or WireShark). This will reveal what the data looks like at the network layer: if correct, debug at subsequent layers. If not correct, check at the network or in prior systems to see where the problem was introduced.
Tools such as ping and traceroute may also help, though a firewall could easily be configured to block these tools, while allowing other traffic through. More comprehensive scanning can be done with nmap.
The following list shows example uses of network debugging commands.
- Use tcpdump on Mac OS X to listen for Domain Name System (DNS) traffic on the wireless (en1) interface, duplicating output to the dns-log file.
- Show traffic for a specific ethernet Medium Access Control (MAC) address with tcpdump.
- Have tcpflow dump any web traffic seen to standard output.
- For complete records with nmap, generate all output formats for scans, and save the scans for future reference.
$ sudo tcpdump -i en1 -l -n port 53 | tee dns-log
tcpdump: verbose output suppressed, use -v or -vv for full protocol decode
listening on en1, link-type EN10MB (Ethernet), capture size 96 bytes
Use control+c to exit from tcpdump.
The following example listens for traffic from a specific JetDirect card on a Hewlett-Packard (HP) printer using the ethernet hardware address of the printer.
$ sudo tcpdump -vv -l ether host 00:01:e6:29:67:98 | tee printer.log
$ sudo tcpflow -c port 80
$ sudo nmap -oA scan-name -sSU -O -v 192.0.2.0/24
Permissions
Permission problems are very common, and often hard to debug if the problem is due to a parent directory and not the file being complained about. Hence, the parsepath utility, which lists permissions including those of any parent directories.
$ parsepath /etc/mail/certs/host.cert
% /etc/mail/certs/host.cert
d 1775 root:admin /
l 0755 root:admin /etc -> private/etc
d 0755 root:wheel /etc/mail
d 0755 root:wheel /etc/mail/certs
f 0644 root:wheel /etc/mail/certs/host.cert
parsepath can also test whether a user or group has access to a file, including checks on access to the parent directories of a file. For example, as part of debugging a Common Gateway Interface (CGI) script problem, use parsepath to check whether the web server user apache can both read and execute a script.
$ parsepath user=apache +rx /var/www/cgi-bin/test-cgi
! unix-other +x fails: f 0644 root:admin /var/www/cgi-bin/test-cgi
$ sudo chmod +x /var/www/cgi-bin/test-cgi
Non-standard Access Control List (ACL) features of different filesystems such as OpenAFS or enhanced security packages may complicate permissions checking. For example, a process running under systrace on OpenBSD might be denied access to a file it would otherwise have rights to access. Applications running on Linux may run afoul SELinux policies. Look into the audt2allow and chcon commands if having problems with SELinux.
Process Tracing
Process tracing is invaluable for debugging or when setting up complicated applications such as OpenLDAP, but the tools available vary by Unix distribution. Also be sure to trace working dæmons, to learn what applications normally look like. This way, if an application later fails, a better comparison can be made, as the normal state will be known.
A word of caution on tracing: collecting the trace logs and delving through the often verbose output can be time consuming. If debugging, first check the system and application logfiles, whether core dumps or crash reports have been created, and other non-time-consuming steps, and only if these reveal nothing then resort to tracing.
Berkeley Software Distribution (BSD)
BSD systems include FreeBSD, Mac OS X, OpenBSD, among others. BSD systems should have ktrace(1) for process tracing, and kdump(1) to parse the output from ktrace. Some flavors of *BSD now support the modern Solaris tracing language DTrace, which replaces ktrace. On these systems, a dtrace script can replicate the functionality of ktrace.
When learning a new application, trace it to better learn the behavior of the application, and to be able to find important files looked for by the program. For instance, the cfagent command of cfengine uses many files under /var/cfengine by default, which ktrace reveals.
$ sudo ktrace /usr/local/sbin/cfagent
$ sudo kdump -f ktrace.out > data
$ grep /var/cfengine data | sort | uniq
9265 cfagent NAMI "/var/cfengine"
9265 cfagent NAMI "/var/cfengine/cf.preconf"
9265 cfagent NAMI "/var/cfengine/cf_learning.db"
9265 cfagent NAMI "/var/cfengine/inputs/cfagent.conf"
9265 cfagent NAMI "/var/cfengine/inputs/cfrc"
9265 cfagent NAMI "/var/cfengine/inputs/update.conf"
9265 cfagent NAMI "/var/cfengine/modules"
9265 cfagent NAMI "/var/cfengine/ppkeys"
9265 cfagent NAMI "/var/cfengine/ppkeys/localhost.priv"
9265 cfagent NAMI "/var/cfengine/randseed"
9265 cfagent NAMI "/var/cfengine/rpc_in"
9265 cfagent NAMI "/var/cfengine/rpc_out"
9265 cfagent NAMI "/var/cfengine/state"
9265 cfagent NAMI "/var/cfengine/state/__db.cf_state.db"
9265 cfagent NAMI "/var/cfengine/state/cf_procs"
9265 cfagent NAMI "/var/cfengine/state/cf_state.db"
9265 cfagent NAMI "/var/cfengine/state/env_data"
DTrace
DTrace requires that a program be written (or procured) to emit the desired output, unlike ktrace or strace, which offer only various command line options to adjust the output with. This means dtrace is much more flexible, at the cost of a steeper and longer learning curve. dtrace also suffers from some portability problems, for example between the native Solaris and Mac OS X, when testing example code from the DTrace Manual:
$ sudo dtrace -s iosnoop.d
DEVICE FILE RW
?? ??/<unknown (NULL v_parent)>/<unknown (NULL v_name)> W
?? ??/<unknown (NULL v_parent)>/<unknown (NULL v_name)> W
Additional DTrace resources:
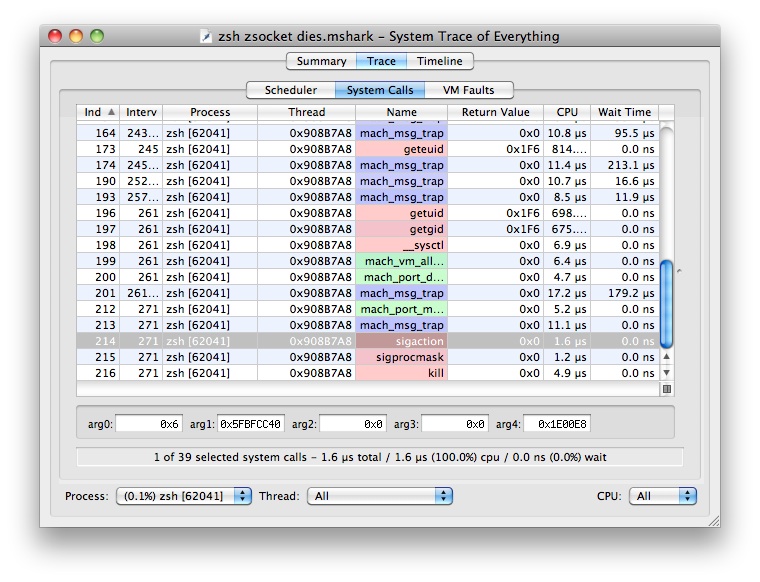
Support for DTrace depends on whether the software supports DTrace (beyond OS level support). For instance, recent Perl releases support DTrace if compiled with the -Dusedtrace option. Consult the Perl source INSTALL file for more details. The Mac OS Xcode package includes Shark.app, an excellent process tracing tool:
Linux
Use strace(1) on Linux systems to trace system calls and signals.
$ strace /bin/echo test
…
# strace -o /root/named.log -p 1432
For applications like xinetd(8), running strace will be complicated as xinetd forks off copies of various programs. One solution to this problem is to use the -o option to write to logfiles, and -ff to follow forks:
$ ps awx | grep xinet[d]
20749 ? S 0:00 xinetd -stayalive -pidfile /var/run/xinetd.pid
$ sudo -H strace -F -ff -o/root/xinetd.log -p 20749
Process 20749 attached - interrupt to quit
Process 20813 attached
[ Process PID=20813 runs in 32 bit mode. ]
PANIC: attached pid 20813 exited
[ Process PID=20749 runs in 64 bit mode. ]
Process 20749 detached
Another solution is to replace the command being run with a shell script wrapper that invokes strace on the desired program:
#!/bin/sh
exec strace -straceargs realcommand --realcommandargs
To only log file related system calls, use the -e trace=file argument to strace. Use this to debug vendor installer scripts.
Programming Languages
Various programming languages will have their own debugging and diagnostic techniques, or may require a C debugger such as gdb, depending on the nature of the problem. That is, low level problems in a Perl program such as core dumps or other errors may require gdb, while higher level problems with something inside the language itself may instead require running the Perl debugger, or inspecting data structures with Data::Dumper, or investigating an object hierarchy. Consult the documentation for the programming language in question to learn the various methods of diagnosing problems in that language. If a protocol is suspect, either inspect the protocol live (for example with a network debugging tool), or via the interface provided by a software library or programming language.
